The T-test is one of the common statistical tests used by statisticians. In this tutorial, you will learn how the T-test google sheets work.
T test google sheets
A T-test is a statistical test that tells you if the difference between the means of two data groups is significant. Hence lets you know if the data readings are strong and the difference is probably not due to any chance.
The output of the t-test is the t value or t score.
- A large t score represents that the groups are different
- A smaller t score represents that the groups are similar
Types of the t-test?
There are 3 types of t-tests.
- One sample t test
- Two sample t test
- Paired t test
When to use which t-test?
1. If there is one group and you are comparing it against a standard value then perform a one-sample t-test.
(Example, comparing the income of women against the national average wage)
2. If the groups came from two different populations, to compare them perform a two-sample t-test.
(Example, comparing income between women and men)
3. If the groups came from one population, then use the paired t-test.
(Example, comparing the income of women before and after the year 2000)
How to do t test in google sheets?
There are mathematical formulas to do the T-test. But google sheets has made it simple using the inbuilt formula. Let’s see how to do t test in google sheets.
Syntax
T.TEST(range1, range2, tails, type)
Input
range1 = the first group of data to compare
range2 = the second group of data to compare
tails = specify the number of distribution tails
If 1: t-test will use one-tailed distribution
If 2: then the t-test will use two-tailed distribution
type = specify the type of t-test
If 1: perform a paired t-test
If 2: perform a two-sample equal variance (homoscedastic) test
If 3: perform a two-sample unequal variance (heteroscedastic) test
Here are some of the important points to consider while inputting the parameters in a t-test:
- tails and type value must be numeric
- range 1 and range 2 must have the same number of data points
Output
The output of the t-test is always a positive value.
If tails are set to 1, T.TEST returns the probability of a higher value of the t-statistic under the assumption that range1 and range2 are samples from populations with the same mean. The value returned by T.TEST when tails are set to 2 is double that returned when tails are set to 1 and correspond to the probability of a higher absolute value of the t-statistic under the “same population means” assumption.
One sample t test google sheets – Example
A one-sample t-test is used to check whether the mean of a population is equal to a standard value.
Example: You have an income list of women and you want to know if their average income is close to the national average. You have collected a list of 10 income data from a random sample of women.
Below, you can see how to use the google sheets t-test to determine if the average wage is close to the national average wage of $38000.
In column A you have the data of a random sample. In column C, I have copied the standard value of $38000 across cells.
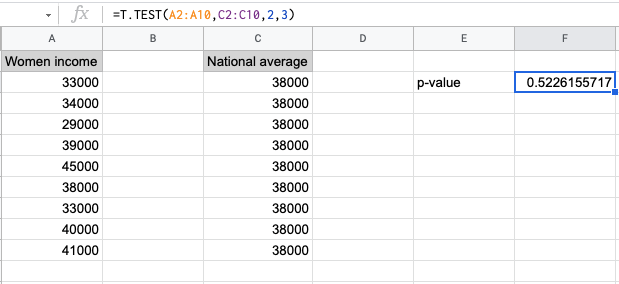
As you can see from the results, the t.test formula outputs a value of 0.55. This is also called the p-value.
So we have a p-value of 0.55. Now let’s see how we reach a conclusion using this.
When we are working with any probability problems, we usually form two hypotheses about the outcome.
One is the null hypothesis and the other is not. The null hypothesis assumes that the assumption is true. Meaning the average wage is equal to the national average. If you prove that this is not true then you are rejecting the null hypothesis.
H0 : mean = $38000 (average wage = national standard)
HA: mean ≠ $38000 (average wage ≠ national standard)
Normally if a p-value is less than or equal to 0.05 is significant in which case, we reject the null hypothesis. If the p-value is greater than 0.05 then we accept the null hypothesis and conclude that there is no significant difference between the two groups of data.
Since here the p-value of 0.55 is more than 0.05, we accept the null hypothesis.
We can say that there is a 55% (p-value) probability that the difference in the two data sets is due to random chance.
Two-sample t test google sheets – Example
A two-sample t-test is used to check whether the means of two populations are equal.
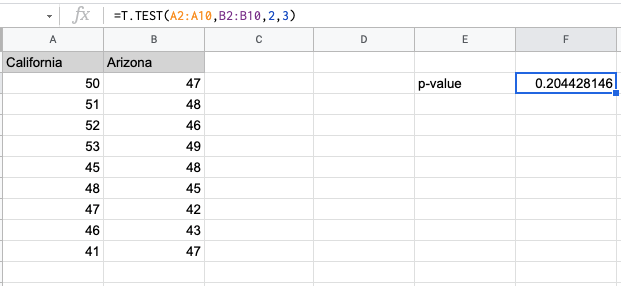
Example: Government wants to know whether the mean air pollution level in the two states is the same. They have collected pollution data from random places in California and Arizona.
Below, you have the list of data for both states. And also you have the result of the t-test in the adjacent column.
Since to conclude the result, we need to form a hypothesis, here are our 2 hypotheses.
H0: the mean of California = the mean of Arizona
HA: the mean of California ≠ the mean of Arizona
The t-test result is 0.20 which also means the p-value is 0.20.
Since the p-value is greater than 0.05, we have to accept the null hypothesis.
Now we can say that there is a 20% probability that the difference in the two data sets is due to random chance.
Paired t test google sheets – Example
In the case of paired t-test, it is used to compare the means of two samples when both the samples have come from one population.
Example:- In a weight loss experiment, a doctor observed one random group of men who followed a specific diet and exercise routine for 2 weeks. After 2 weeks their weights are recorded. Then the doctor gave them a special medicine for weight loss and after 2 weeks, collected their weight data to see if there was any impact.
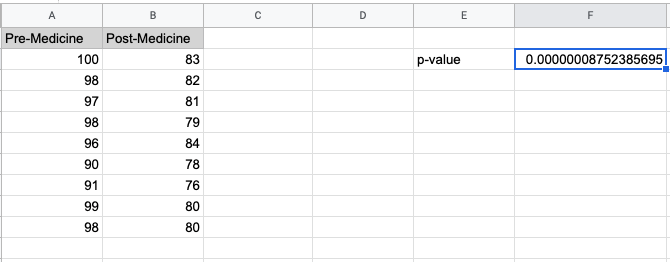
In the following screenshot, we have pre-medicine data in column A and post medicine data in column B. We can perform the t-test and show the result in column D.
The two hypotheses are:
H0: mean of pre-Medicine = mean of post-Medicine
HA: mean of pre-Medicine ≠ mean of post-Medicine
From the t-test, we found that the p-value is 0.00000008. Since the p-value is less than 0.05, then we will reject the null hypothesis.
We can say that there is a significant difference between the two data sets. Meaning the weights are significantly different before and after taking the prescribed medicine.
FAQ
How do you use the T test google sheets?
You can use the T-test in google sheets to find out the p-value for a given data set. From there you can determine whether to accept or reject the null hypothesis.
What is the formula for the t test google sheets?
The formula for the T-test is T.TEST(range1, range2, tails, type)
When should you not use the t test google sheets?
The T test google sheets can only be used when you are comparing the means of two groups. If you want to check for more than two groups or if you want to do multiple pairwise comparisons, you can use the Anova test.
Wrapping up
In this tutorial, we learned about the T test google sheets formula. You also learned about one sample, two samples, and paired t test google sheets. I hope this has been useful to you. Go ahead and try these on your worksheet.
Appendix
[1] T test google sheets formula – Link
Further Reading
New to google sheets ? Start here
More related to Formulas:
Learn more about Google sheets Formulas.
Logical functions in google sheets
Error handling in google sheets
